Mainland China released its latest economic data on October 19, reporting a rebound in the country’s GDP. FactWire found that the growth rates of two economic indicators – fixed-asset investment and consumable retail – are affected by a revision of last year’s data, while the revision is not reflected in past records.

Mainland China released its latest economic data on October 19, reporting a rebound in the country’s gross domestic product (GDP). FactWire found that the growth rates of two economic indicators – fixed-asset investment and consumable retail – are affected by a revision of last year’s data, while the revision is not reflected in past records.
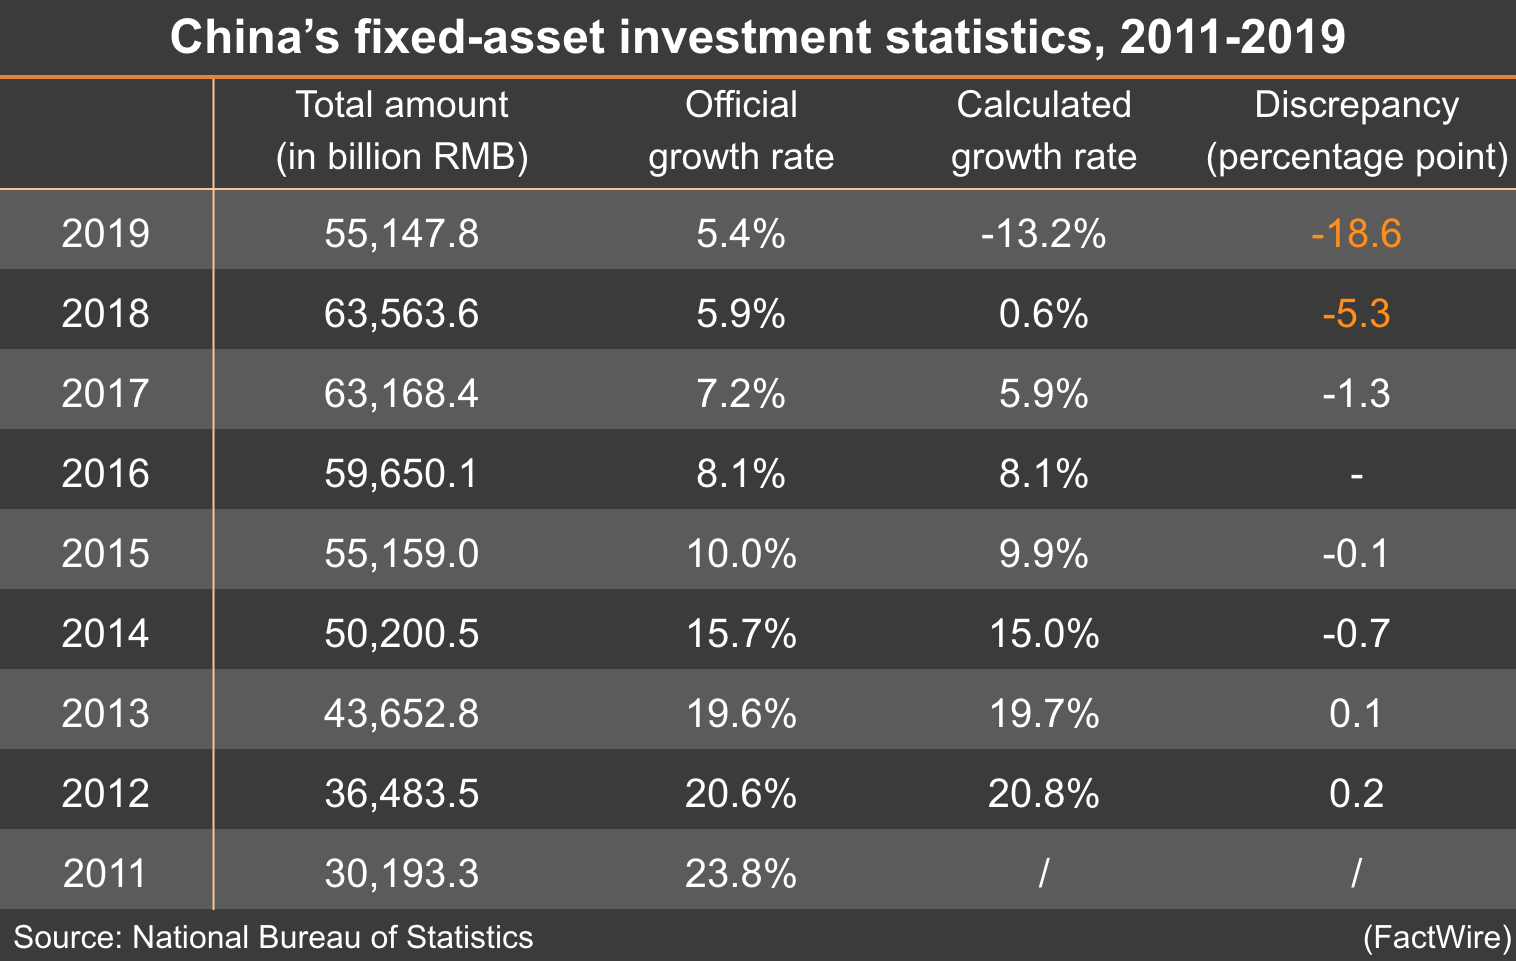
The figures released in Mainland China’s National Bureau of Statistics (NBS) notices are found to be contradictory. For instance, the fixed-asset investment growth rate of 2018-2019 was officially announced as 5.4 percent, but when calculated from the absolute amounts released in 2018 and 2019, the growth rate amounts to -13.2 percent instead. Similar situations have been found in 2017 and 2018 as well, resulting in an overall 27 percentage point discrepancy across three years.
In a response to FactWire’s enquiry, the NBS confirmed that the year-on-year growth rates are the results of revisions of last year’s data, and that the revised amount is not updated for past records.
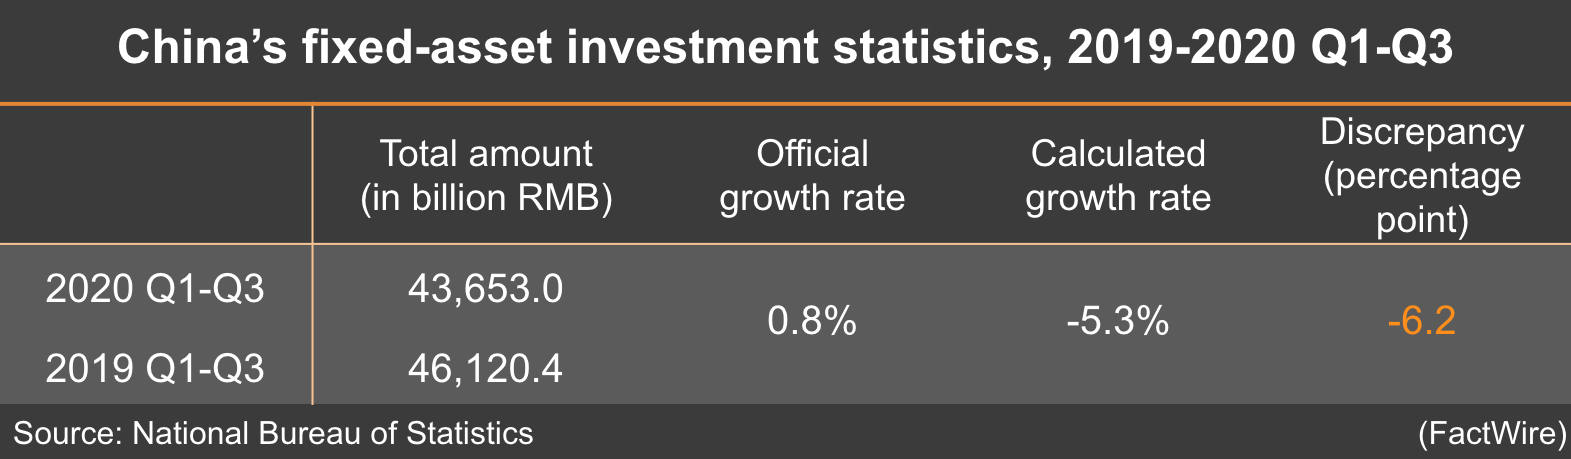
The latest economic notice of the NBS reports that – compared to the first three quarters of 2019 – national investments in fixed assets increased by 0.8 percent to 43.65 trillion RMB in 2020. However, the investment amount of 2019’s third-quarter notice states 46.12 trillion RMB. Based on this unrevised amount, the change would be a decrease of 5.3 percent instead. The difference in percentage change with what was reported this year exceeds six percentage points.
A remark on the notice states that 2019’s base data was revised ‘according to results of statistical law enforcement inspection and the fourth national economic census unit inventory’, adding that the growth rate was calculated on a ‘comparable basis’. In its Chinese version, the factors affecting the revision also include a ‘regulation on the statistical system.’
Fixed-asset investment data is only available on the NBS website beginning in 2011. FactWire studied the notices from the past nine years and found similar remarks about the revision of previous year’s data in notices dating from January to September 2020, throughout 2019, and in December 2018.
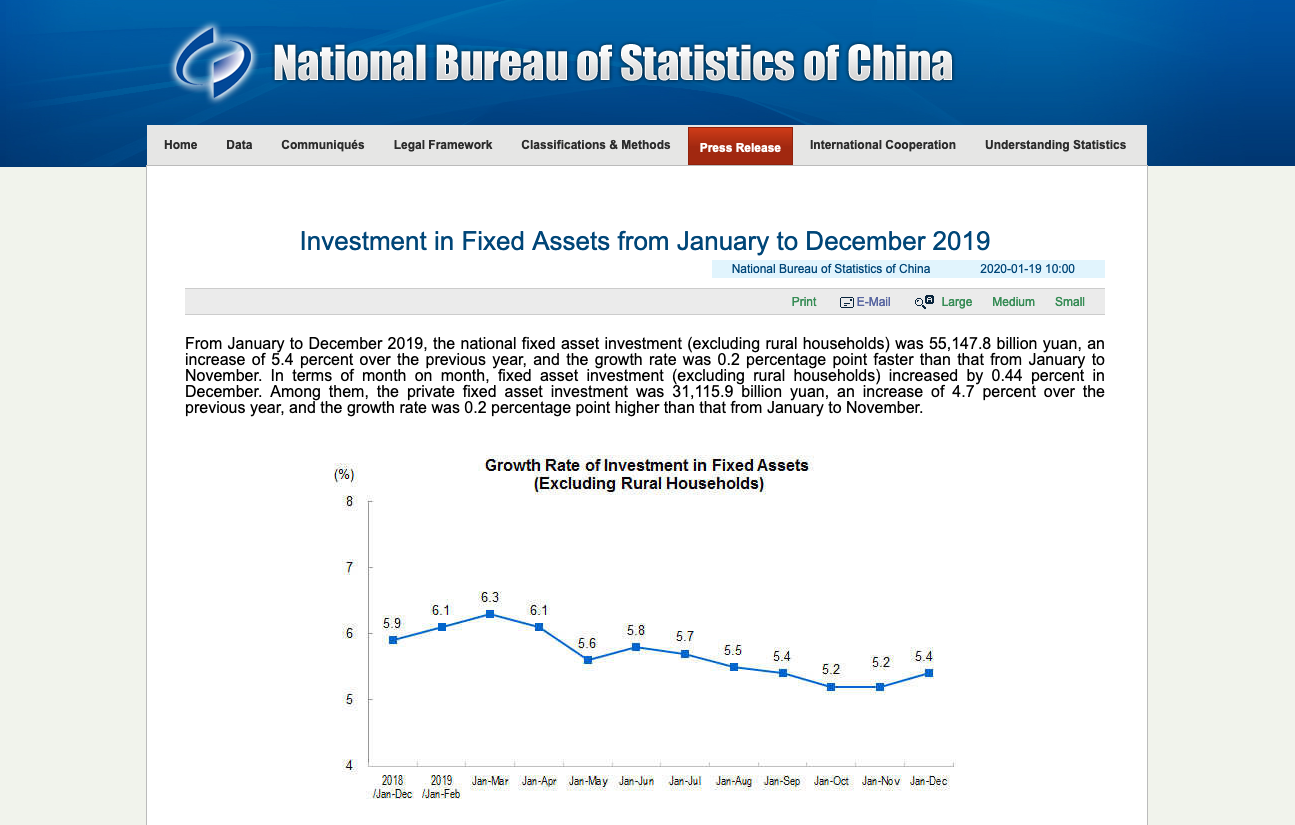
In the notice published in December 2019, the total fixed-asset investment in 2019 is 55.15 trillion RMB while its year-on-year growth is 5.4 percent. However, the amount stated on December 2018’s notice (63.56 trillion RMB) produces a year-on-year change of -13.2 percent, 18.6 percentage points less than what was released in 2019.
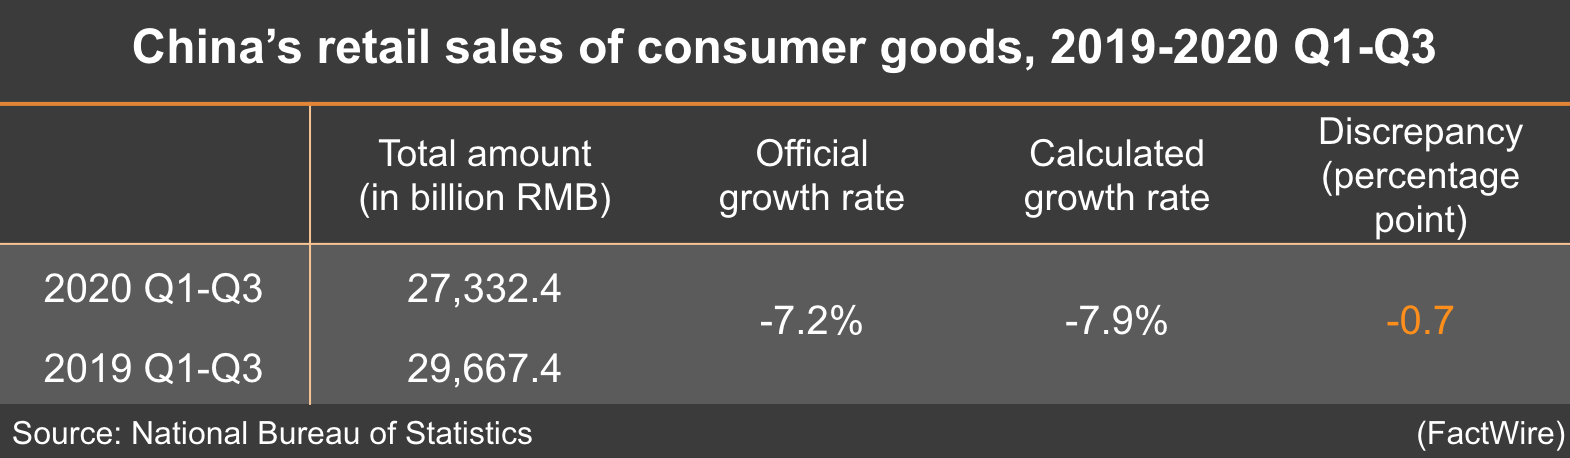
The same practice of revising past numbers can be seen in retail statistics. According to a notice released this month, total retail sales of consumer goods in the first three quarters of this year is 27.33 trillion RMB, down 7.2 percent from the same period last year. On the other hand, last year’s October notice states the amount in 2019 as 29.67 trillion. Calculating from this unrevised amount results in a 7.9 percent drop this year instead. There is a 0.7 percentage point discrepancy before and after the revision of 2019’s amount.
‘According to the results of the fourth national economic census, the total retail sales of consumer goods in 2019 are revised, and the monthly growth rate in 2020 is calculated according to the comparable caliber,’ states a remark in the notice.
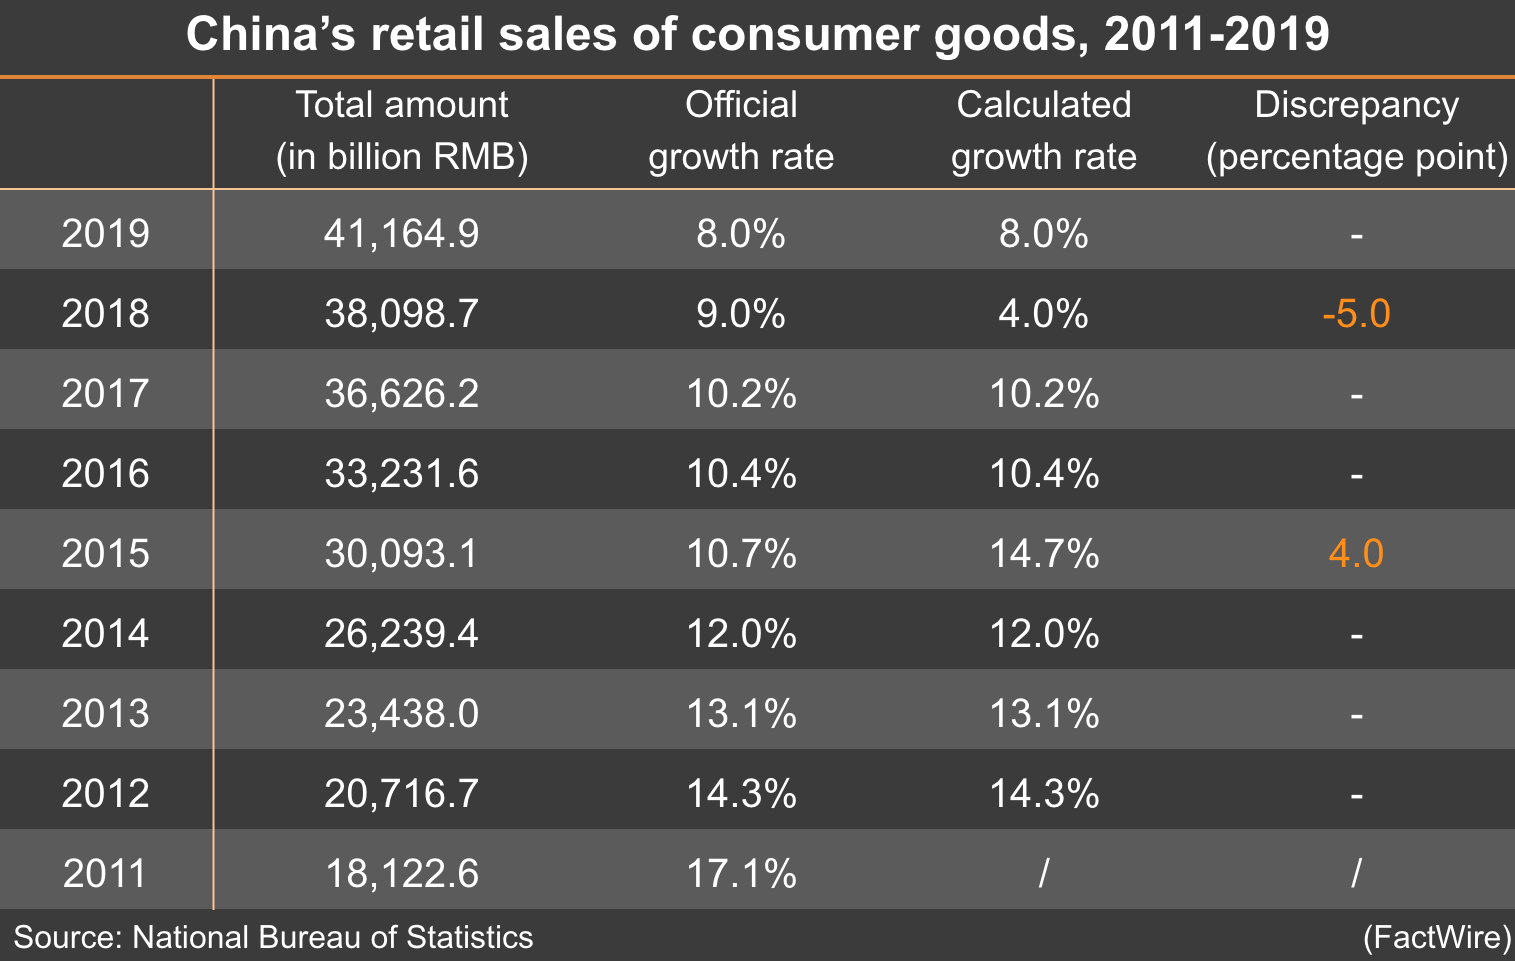
Similar revision remarks are found in the 2018 and 2015 notices. For example, 2018’s notice states a nine percent year-on-year growth in total consumable retail, contradictory to what is calculated from 2017 and 2018’s released amount. A remark on that notice states that the data of the same period last year was revised ‘according to the results of the third national agricultural census and related regulations’, and that ‘the growth rates are calculated on a comparable base.’
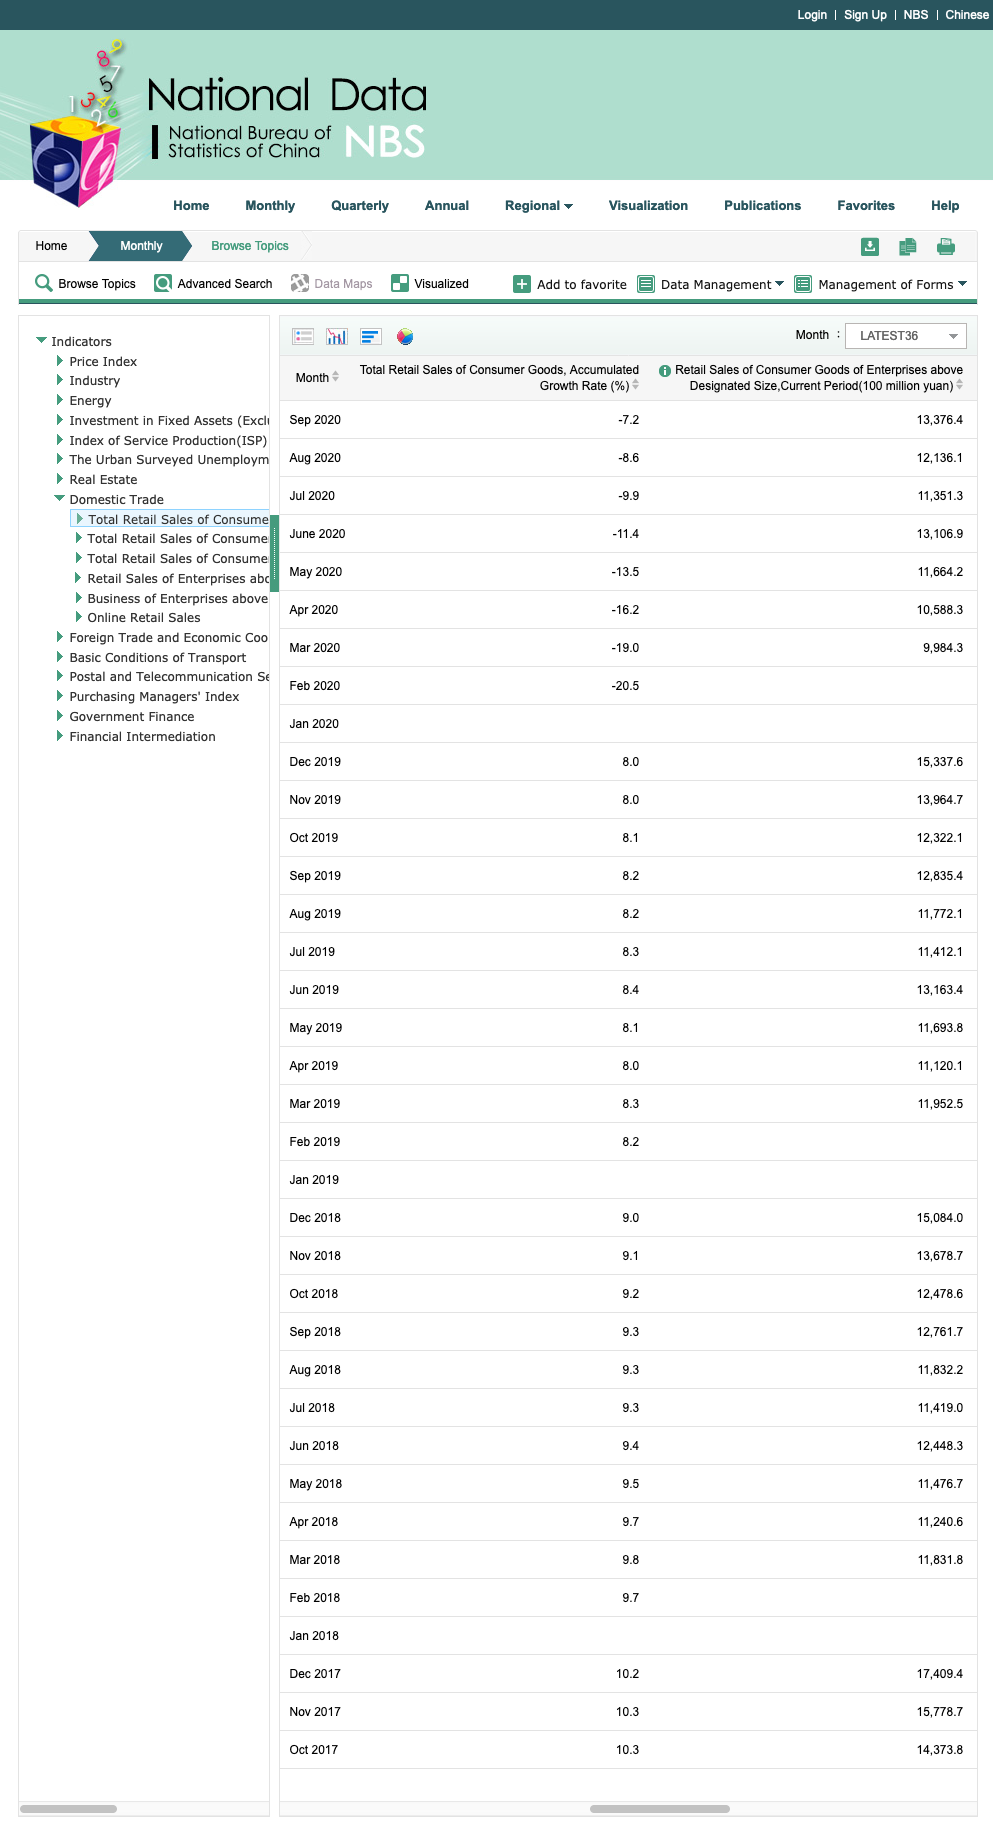
For both the economic indicators, despite revisions done according to census results and the statistical system, the NBS had only been releasing percentage changes that reflect a revision of the previous year’s amount – without stating the revised amount. Even search results in the NBS database (https://data.stats.gov.cn) show only unrevised amounts that are at variance with the growth rates released.
The differences caused by each year’s revisions are magnified by accumulating data across multiple years. FactWire calculated two different versions of cumulative growth from 2011 to 2019, by using sets of data from the NBS. One set of data was calculated from the unrevised amounts of 2011 and 2019, and the other set of data used the growth rates based on revised data from the previous year. Both sets of data – the unrevised amount and the growth rate based on revised data – were obtained from the official NBS notices.
Based on unrevised data, fixed-asset investments of 30.19 trillion RMB in 2011 had gone up by almost 83 percent to 55.15 trillion RMB in 2019. In contrast, based on the growth rate calculated from a revised amount of the previous year, there is an accumulated growth of 137 percent. The two versions of cumulative growth rates differ by over 54 percentage points.
The 54 percentage point difference is mostly attributed to the revisions done in the recent three years. A comparison of investment amounts shows a 7.5 percent drop from 2016 to 2019. This is 27 percentage points away from the 19.7 percent rise calculated from the year-on-year growth rates released in 2017 to 2019.
Revision remarks are included in the 2018 and 2019 notices. It is not found in the 2017 notice although FactWire found a 1.3 percentage point discrepancy in the growth rate between 2016 and 2017.
Consumable retail data from 2011 to 2019 was also analysed. The cumulative growth rate based on released year-on-year growth rates is 2.4 percentage points more than the rate based on unrevised amounts. The smaller difference, relative to that of fixed-asset investment, is due to a cancelling out of growth: revised numbers from 2015 caused a drop in four percentage points, while 2018’s revision led to more than a five percentage point increase.
FactWire enquired the NBS through its data consultation hotline. The bureau confirmed that the growth rates listed in its database are calculated after the revision of data, while the absolute amounts have not been updated accordingly.
It admitted that the absolute amounts and rates are inconsistent with each other, making it impossible to compare data across multiple years. It is wrong for research organisations to make such comparisons by quoting these figures, said the NBS.
The bureau added that the economic census acts as a secondary inspection on past data. The numbers are first estimated, then revised according to the census results. It stressed that the revised data is more reliable in reflecting the true economic situation of that year.
That being said, inconsistently calculated figures can be found in some of the official NBS notices as well. In ‘Investment in Fixed Assets from January to December 2019’ published in January 2020, a graph shows that fixed-asset investment in 2019 had increased by 5.4 percent compared to 2018, which is calculated using a revised amount of 2018. Yet, the growth rate of 2017-2018, shown on the same graph, is calculated based on an unrevised amount of 2018.
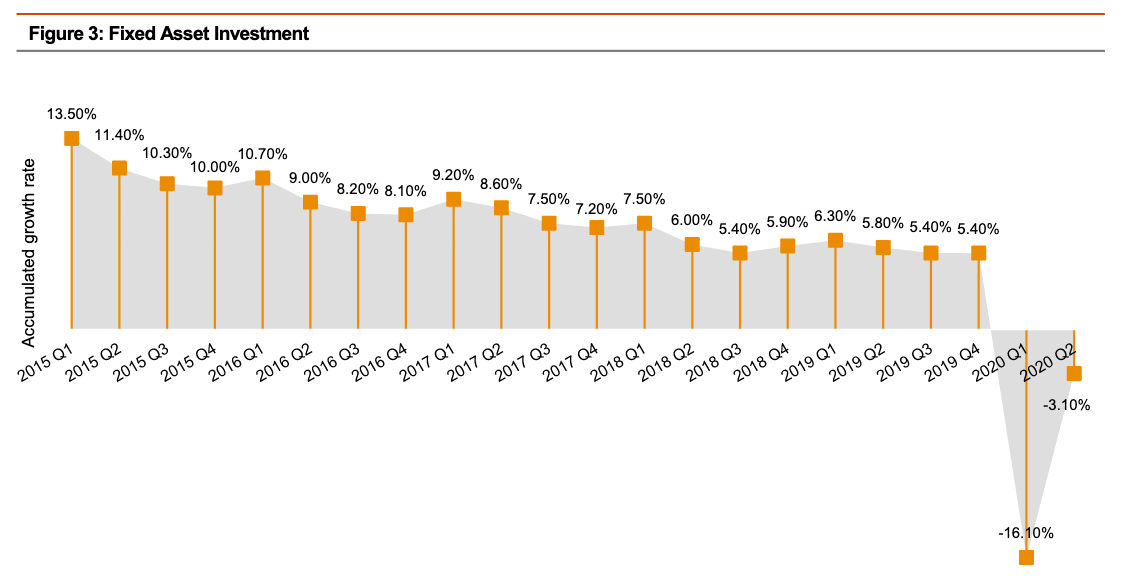
The same mistake appears in the report ‘China Economic Quarterly Q2/Q3 2020’ published by PwC China in September this year, in which the growth rates of fixed-asset investment in each year’s official release are included in the same table. Another report named ‘China consumer report 2020’ by McKinsey and Company also lists inconsistently calculated rates in an included table.
‘I’ve never heard that this kind of data cannot be compared across multiple years – even for GDP?’ doubted Tommy Leung, an economics associate professor at Wake Forest University and a member of the Hong Kong Institute of Asia-Pacific Studies’ Economic Research Centre. He pointed out that the problem can be fixed simply by officially updating the numbers after revision.
Leung explained that fixed-asset investment and consumable retail are two of the essential pillars of China’s economy. Fixed-asset investment is an indicator of corporates’ productivity, while consumable retail plays an important role in the ‘internal circulation’ idea of domestic production, distribution and consumption raised by Chinese President Xi Jinping in May this year.
‘I think the main problem is that those numbers become less informative if they (NBS) change their methodology frequently.’
‘I think the main problem is that those numbers become less informative if they (NBS) change their methodology frequently,’ said Leung. When referring to practices in Europe and the US, he said that changes in methodology would be more transparent and less frequent, with a frequency of about once every decade.
If sampling is not affected in the revision, data can easily be revised accordingly for the past five years at least, in order to make it comparable across years, said Leung.
The NBS’s revisions of past data often rely on the results of Mainland China’s national economic census, which has been held once every five years since 2004. The fourth census was conducted in 2019, which collected corporate data of the 2018 calendar year (excluding the agricultural sector). According to the Regulations on National Economic Census, the main contents of the economic census include the nature of the company and its business, the number of employees and their level of education, its assets and debts, and its production and business operation situations.
When asked about Hong Kong’s practices, Hong Kong’s Census and Statistics Department told FactWire that there have been ten rounds of non-routine technical revision exercises on the city’s GDP since 1980. In these exercises, the entire series of GDP and its components may be subject to revision in accordance with the scope of the exercise concerned.
According to the ‘2019 Gross Domestic Product’ report published by the department in March this year, in October 2007’s revision exercise, the entire volume series was backcast to 1987 in order to ‘maintain the comparability of the volume series of GDP and its components.’
A revision exercise was conducted in 2012 in regard to the latest international statistical standards at that time. It is not included in the report regarding whether backcasting was done for this revision exercise.
The report states that the latest round of technical revision of Hong Kong’s GDP was in August 2013, with relevant figures revised back to 2009.