In the latest release of Chinese yearly economic growth rates, calculated based on the revised amounts of the previous year, the NBS made a corresponding update on the annual amounts of consumable retail in the past, but not on monthly amounts, thus causing contradiction. Past records of fixed-asset investment remain unrevised.
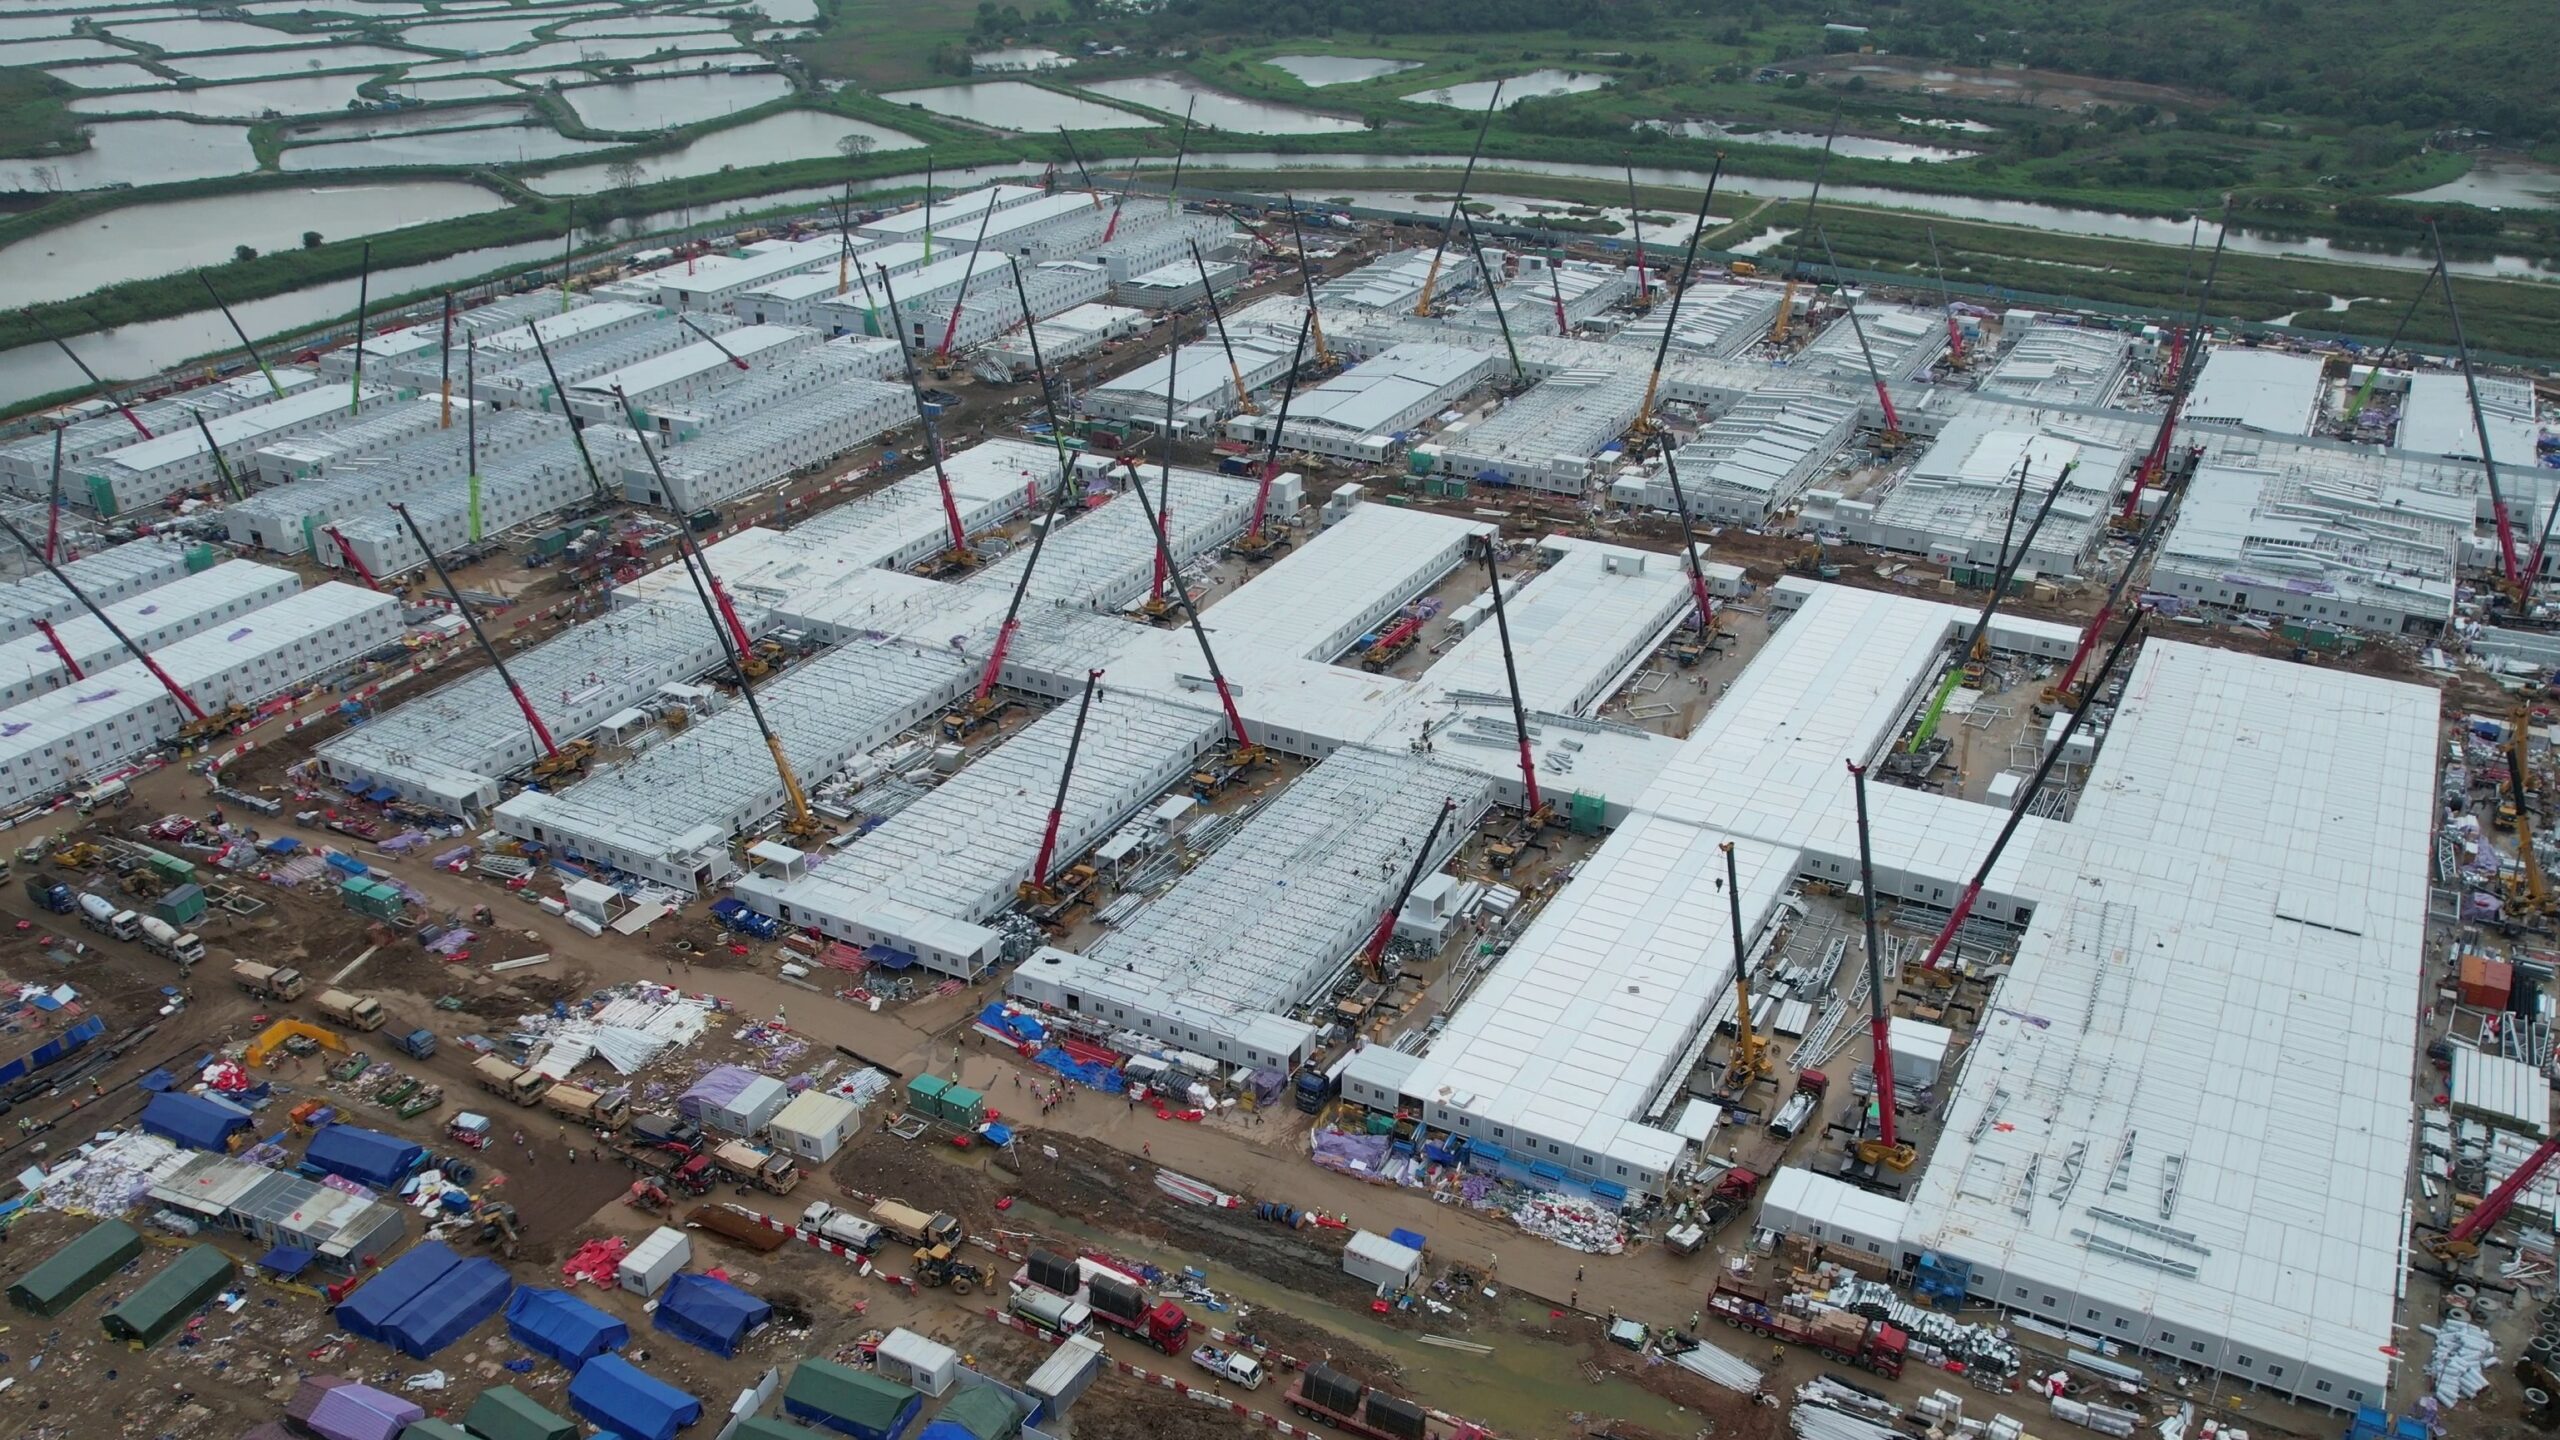
Mainland China released today (January 18) its annual gross domestic product (GDP) figures of 2020, reporting a 2.3 percent yearly growth. Head of National Bureau of Statistics (NBS) Ning Jizhe predicted China to be the only major economy with a GDP growth. The growth rates of some of the indicators are, however, inconsistent with some of the past absolute amounts listed in the NBS database.
A report by FactWire in October 2020 found a similar contradiction between the year-on-year growth rates of the first three quarters and the corresponding absolute amounts published in the past, which was caused by a revision of the previous year’s figures together with outdated past records that show unrevised figures.
In the latest release of yearly growth rates, also calculated based on the revised amounts of the previous year, the NBS made a corresponding update on the annual amounts of consumable retail in the past, but not on monthly amounts, thus causing contradiction. Past records of fixed-asset investment remain unrevised.
An economics scholar told FactWire that it is common for market and research organisations to quote figures from the NBS database, thus inconsistency among figures in the database may lead to the wrong calculations and analysis.
Related: China releases contradictory economic figures based on a mix of revised and unrevised data
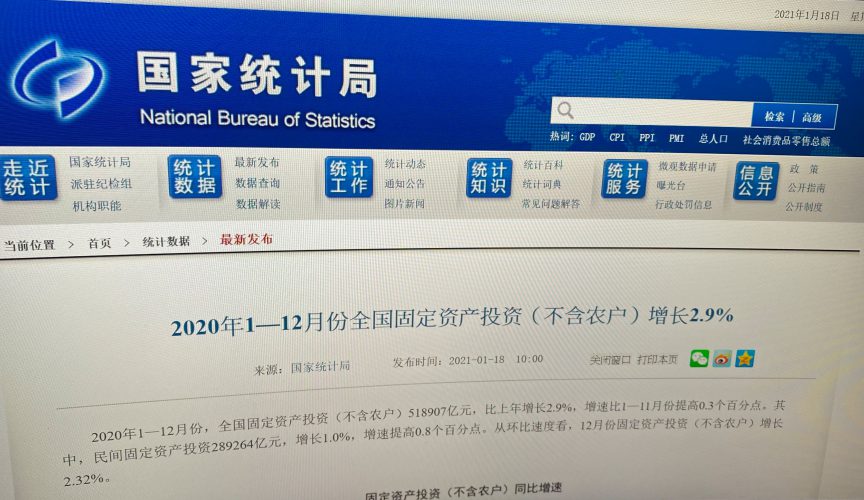
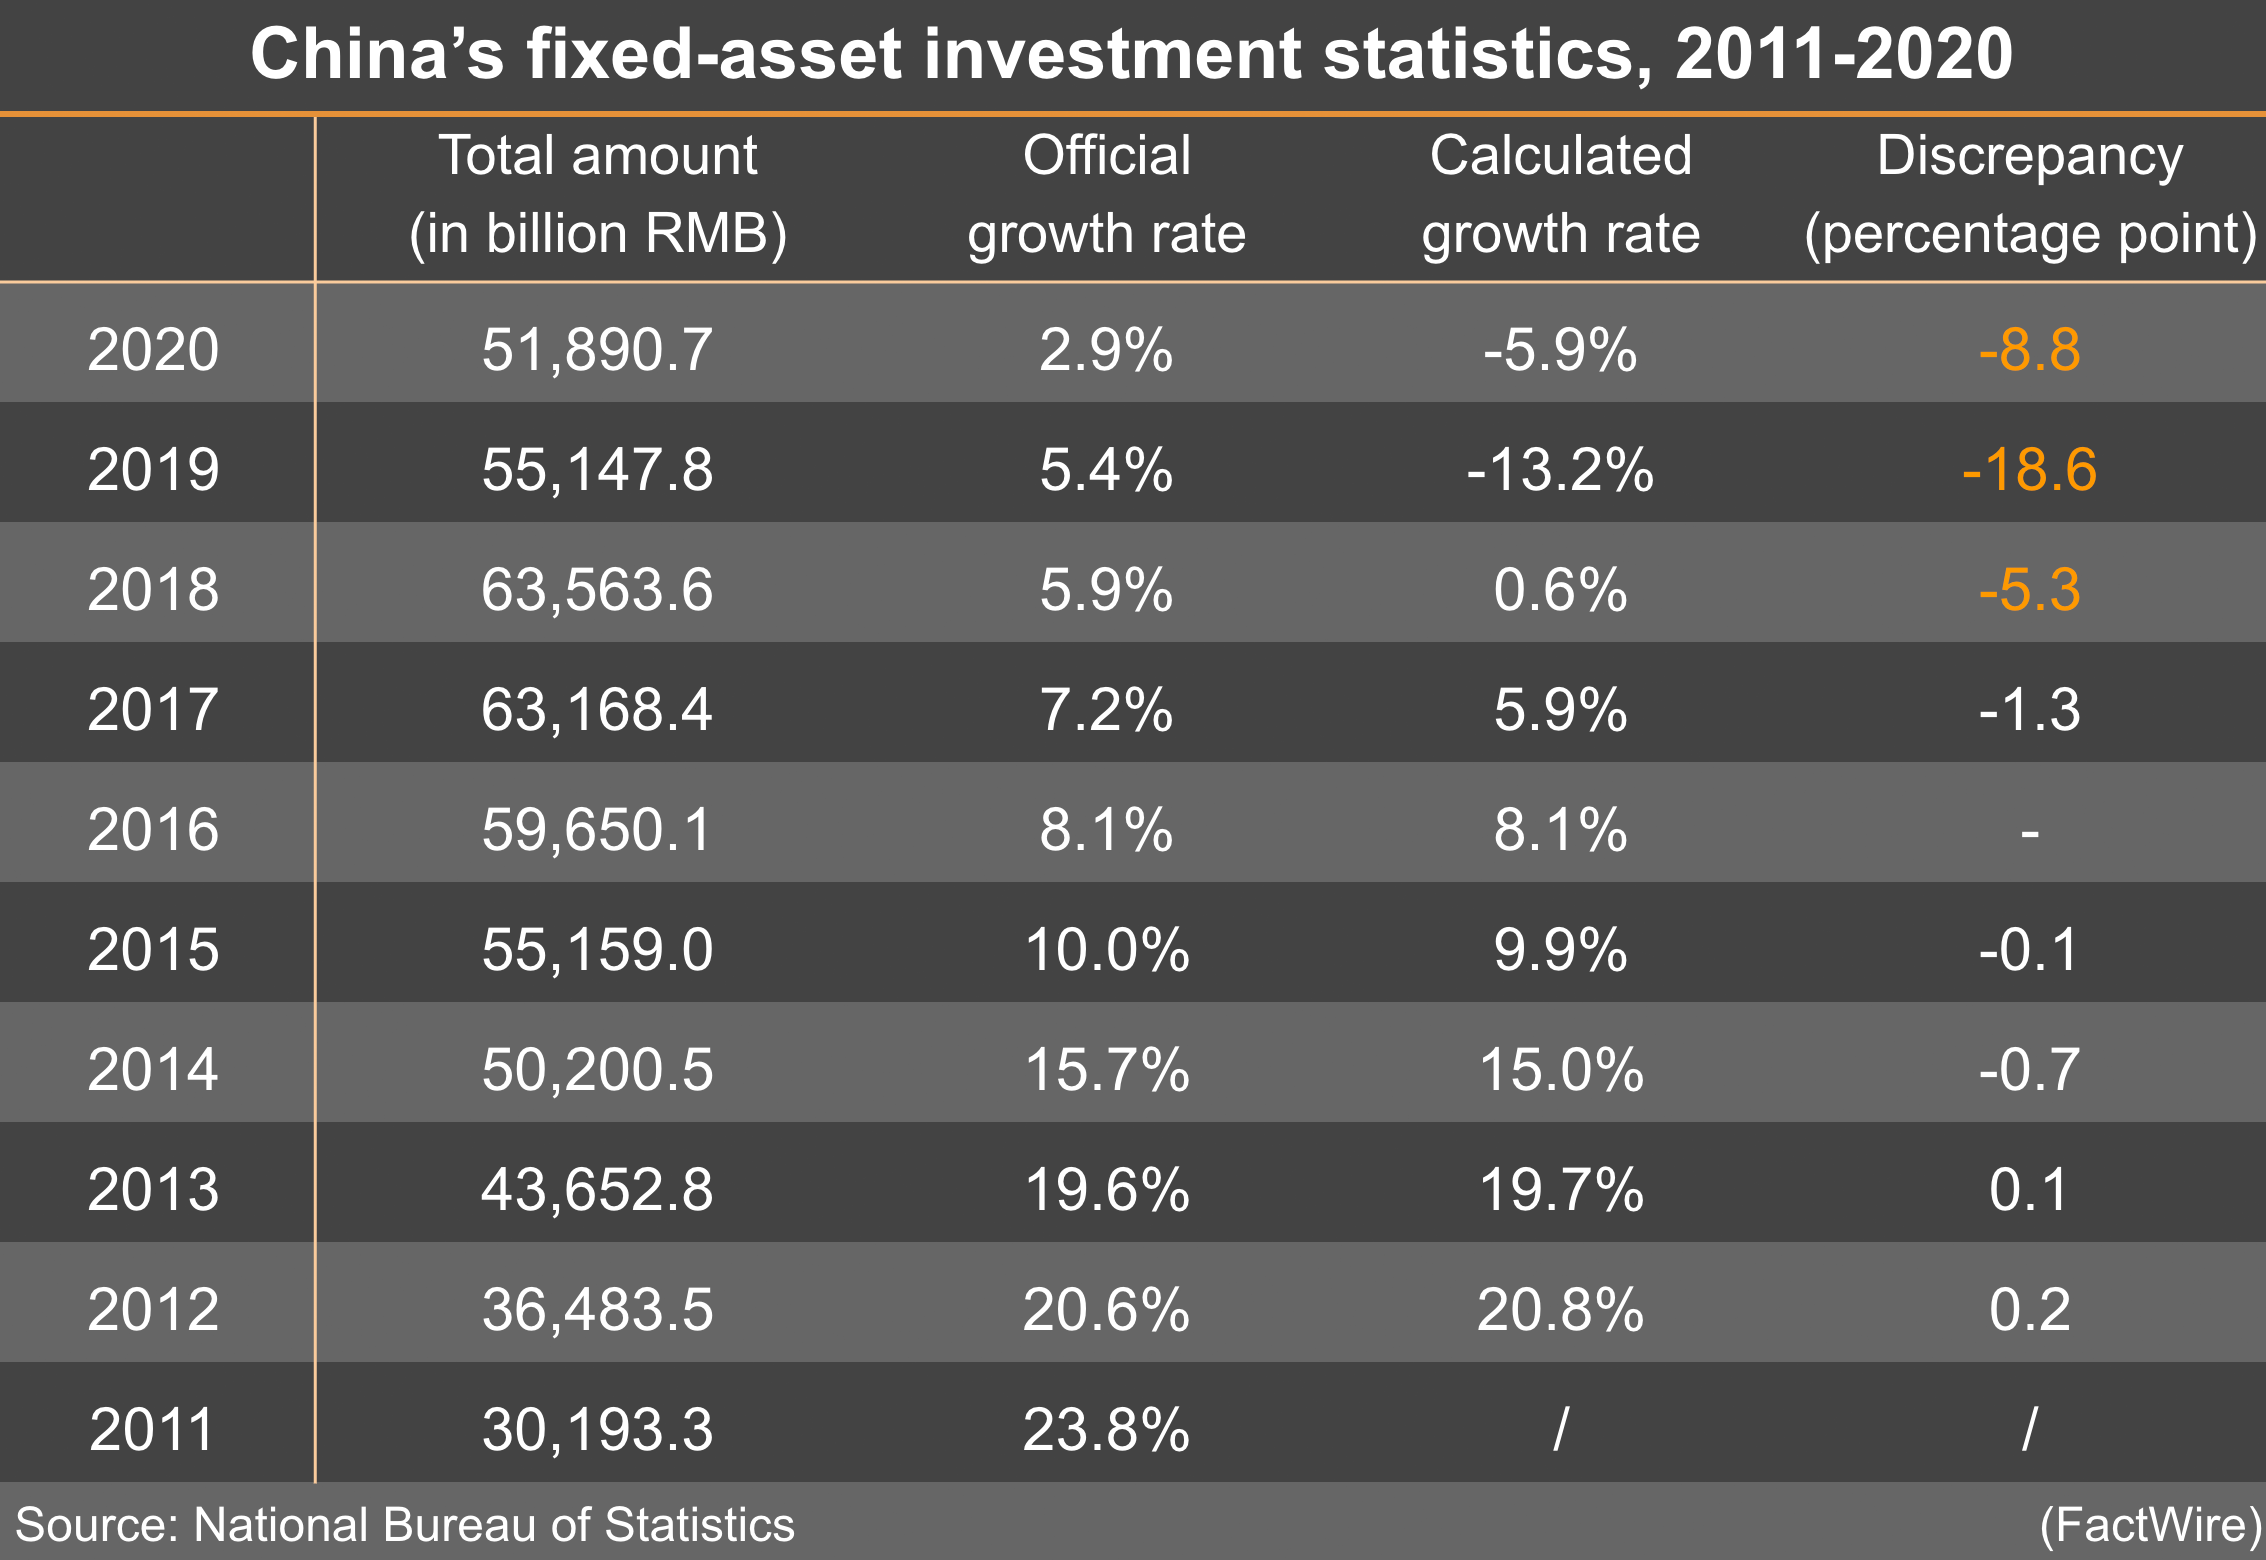
Contradictory growth rates have been spotted in two major economic indicators of China, namely in fixed-asset investment and consumable retail. According to the latest notice by NBS, China’s national fixed-asset investment in 2020 is 51.89 trillion RMB, with 2.9 percent increase compared to 2019. On the other hand, the investment in 2019 as announced in last year’s notice is 55.15 trillion RMB, resulting in a calculation of 5.9 percent drop instead from 2019 to 2020. The two versions of rates differ by nearly nine percentage points.
As with the notice released last quarter, a remark in today’s notice states that the data of the same period last year are revised according to results of statistical law enforcement inspection and the fourth national economic census unit inventory, and that ‘the growth rate is calculated on comparable basis’.
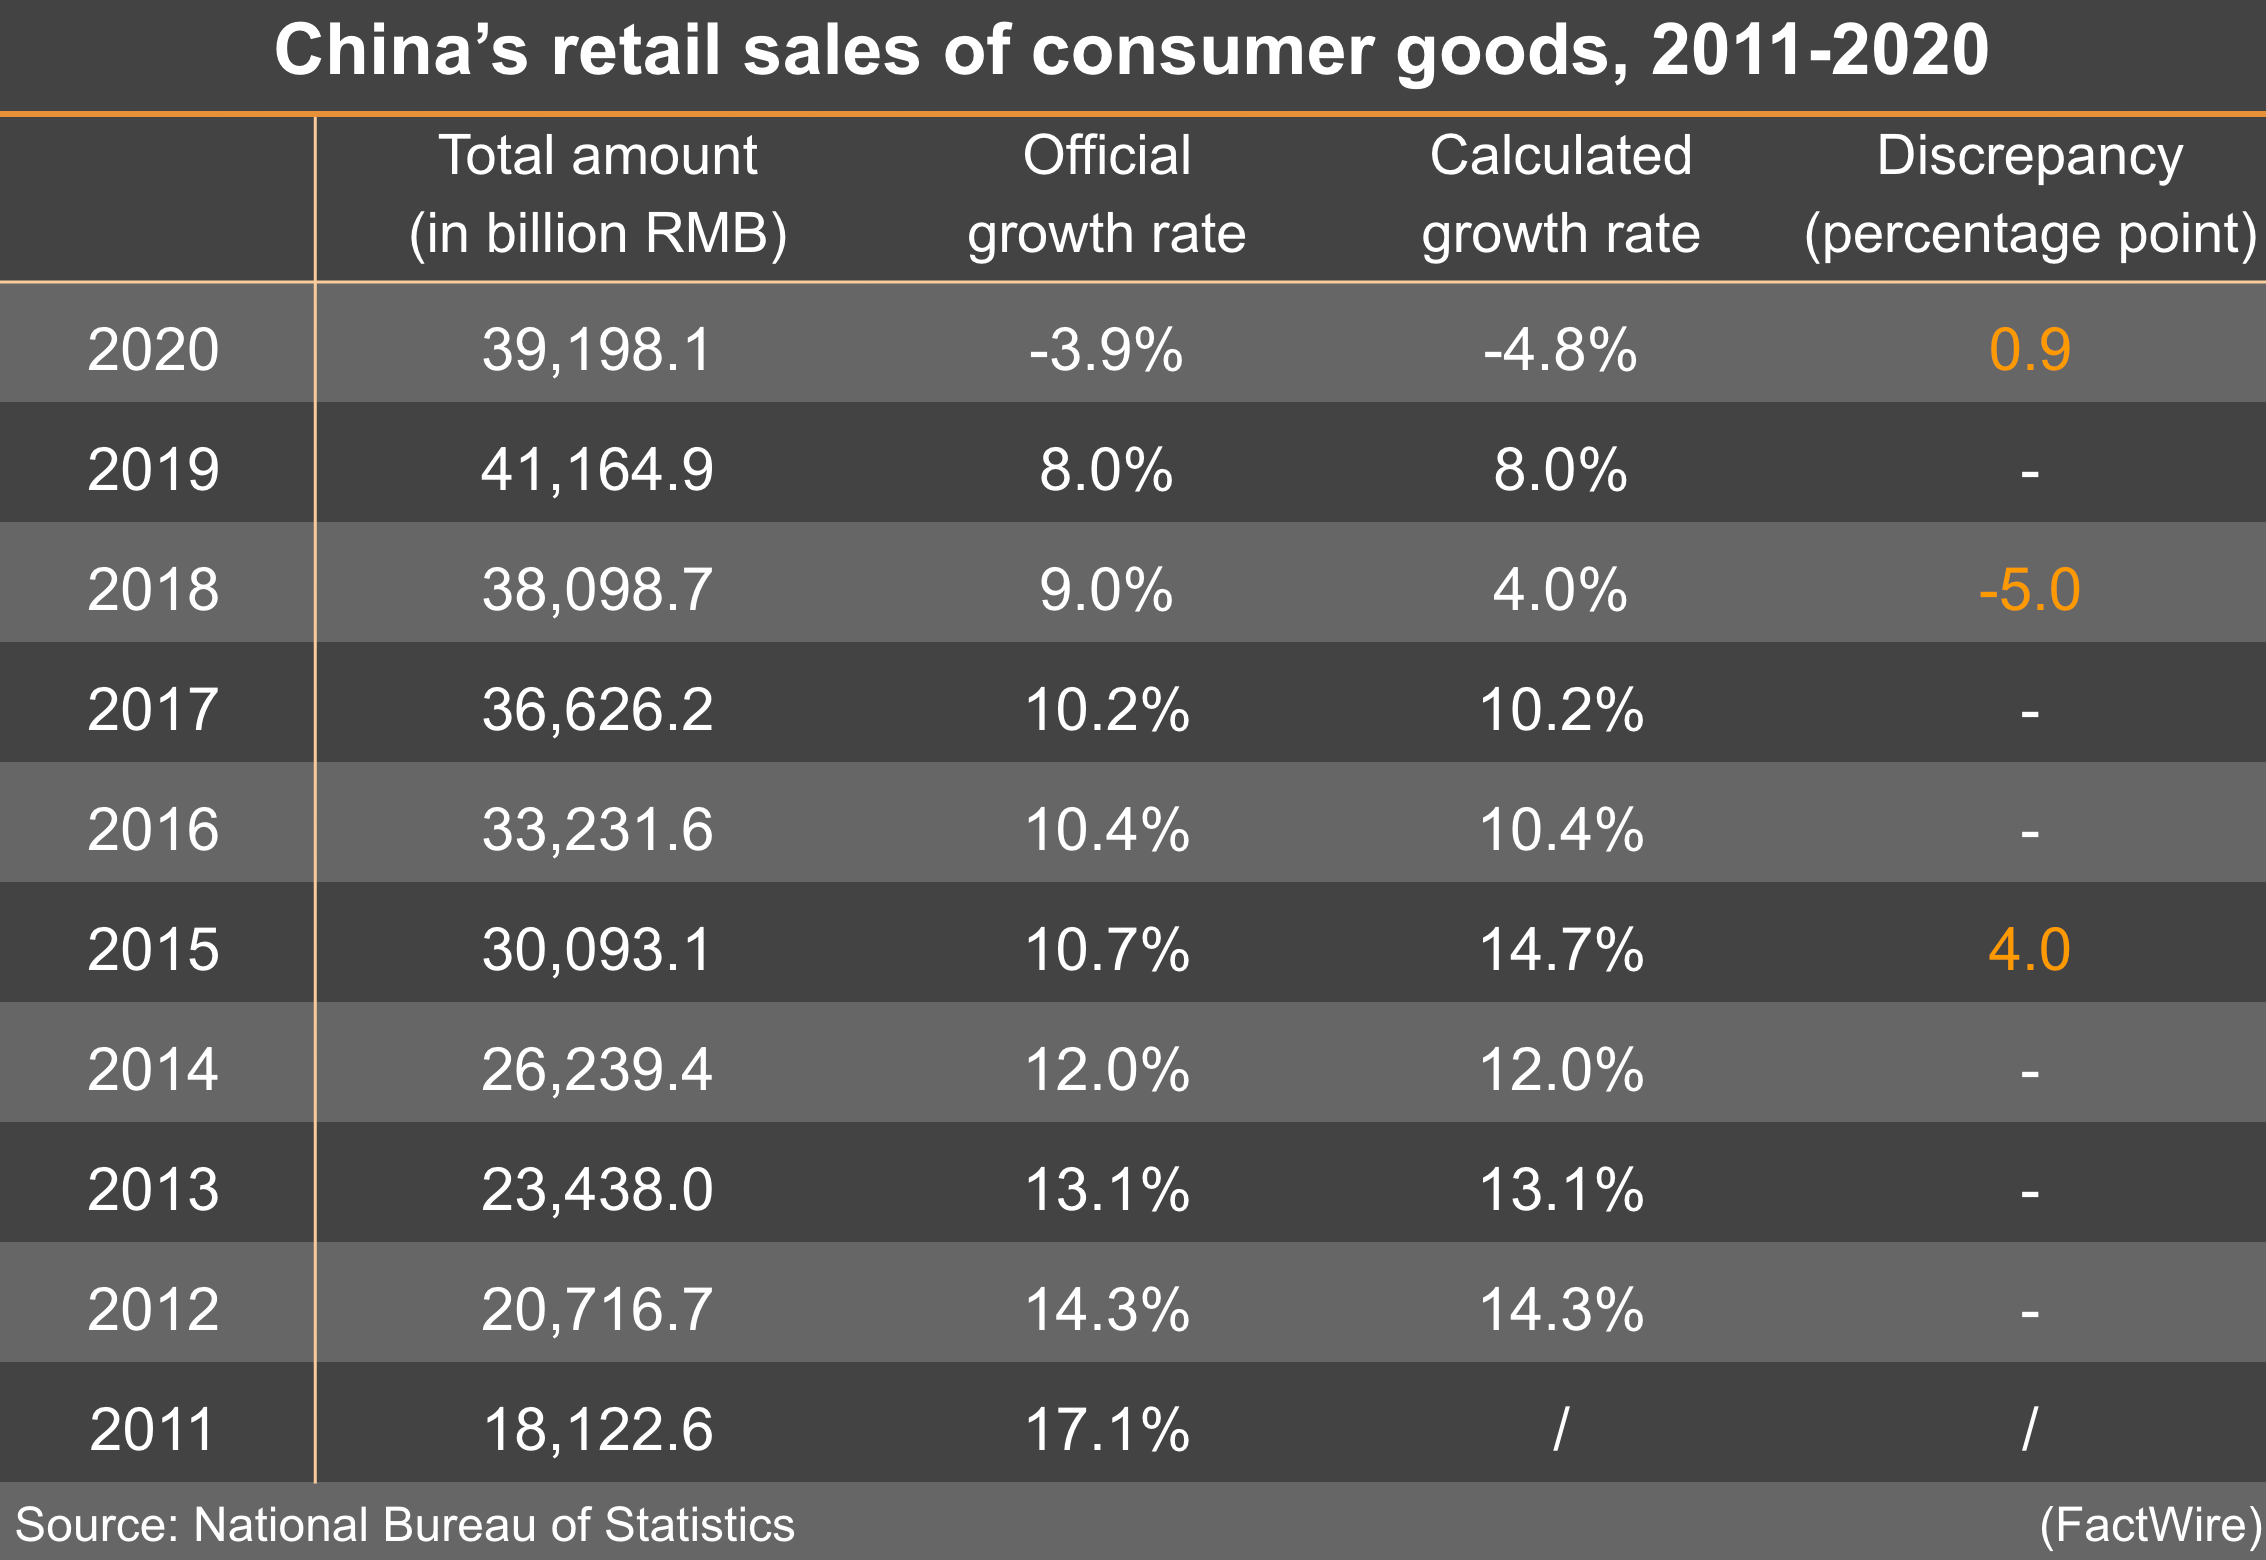
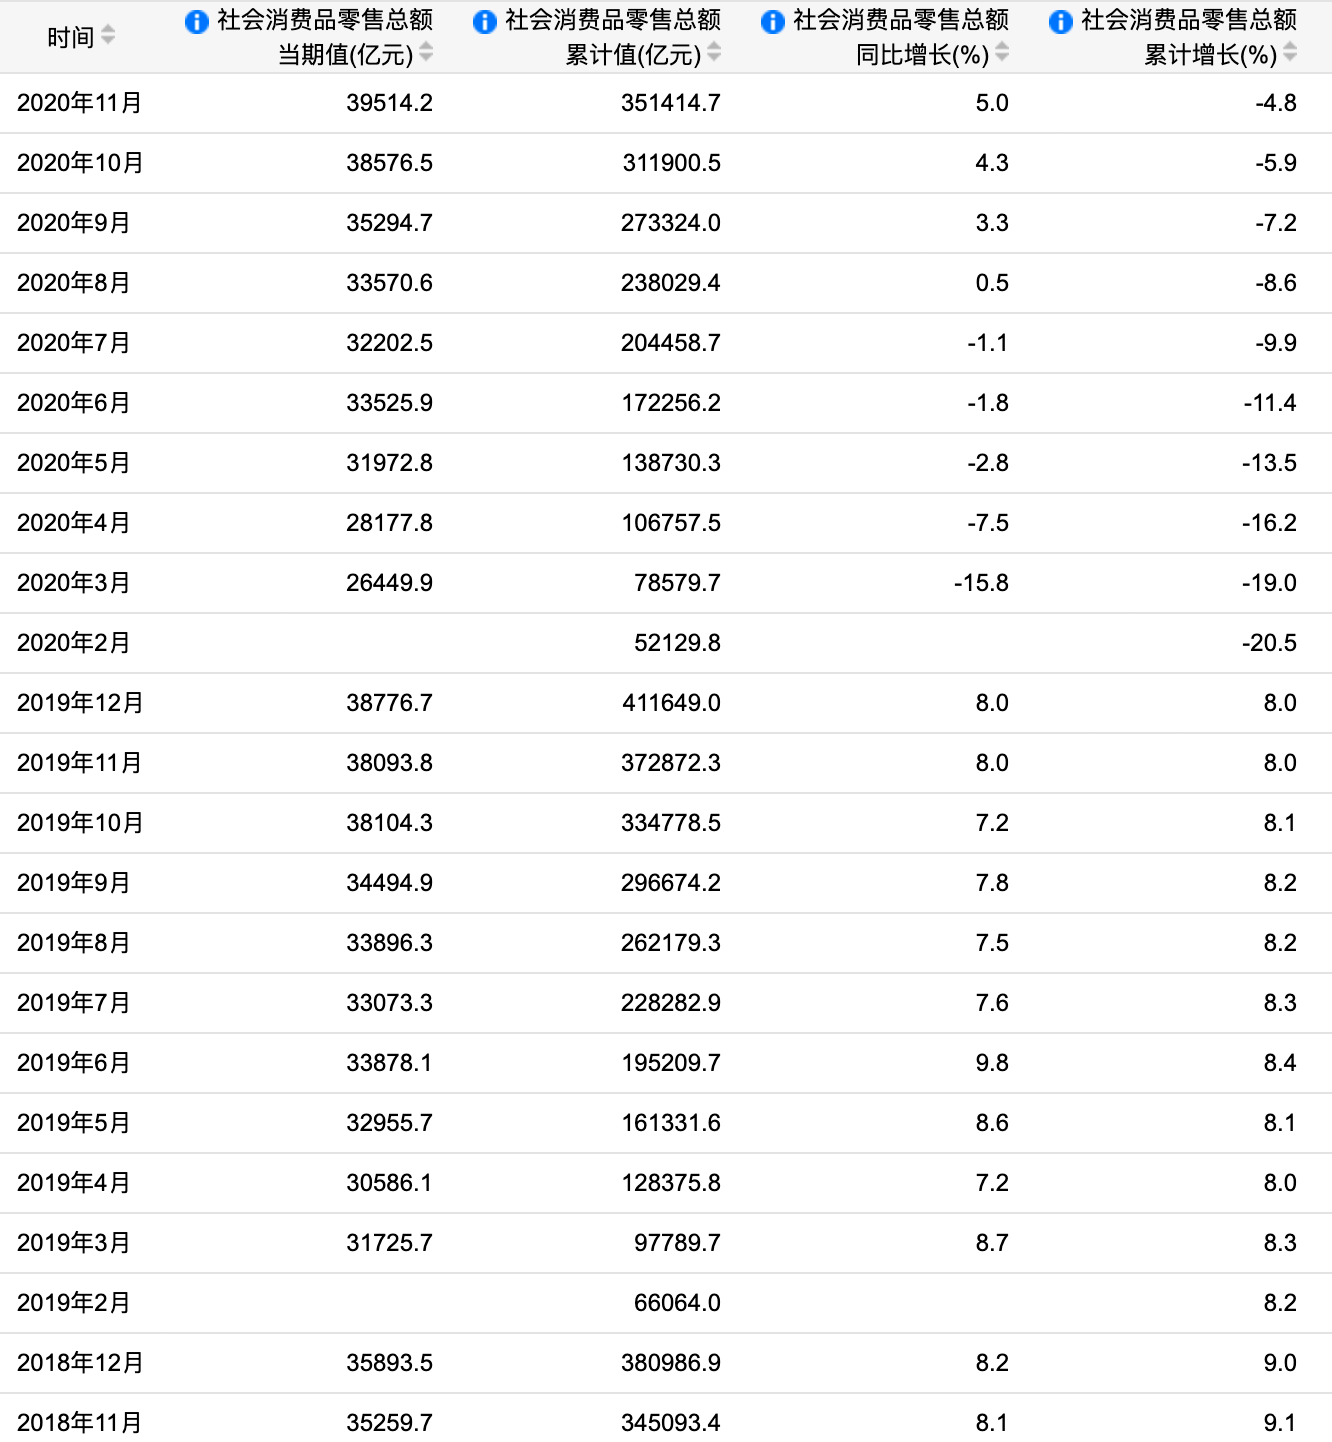
As for the total retail sales in consumer goods, according to today’s notice, it has decreased by 3.9 percent to 39.2 trillion RMB in 2020. Yet, the 2019 amount stated in last year’s notice is 41.16 trillion RMB, and with this the drop for 2019-2020 would have been calculated as 4.8 percent instead. The two versions differ by about 0.9 percentage point.
‘According to the results of the fourth national economic census, the total retail sales of consumer goods in 2019 are revised, and the monthly growth rate in 2020 is calculated according to the comparable caliber,’ reads a remark on today’s notice, similar to what was published last quarter.
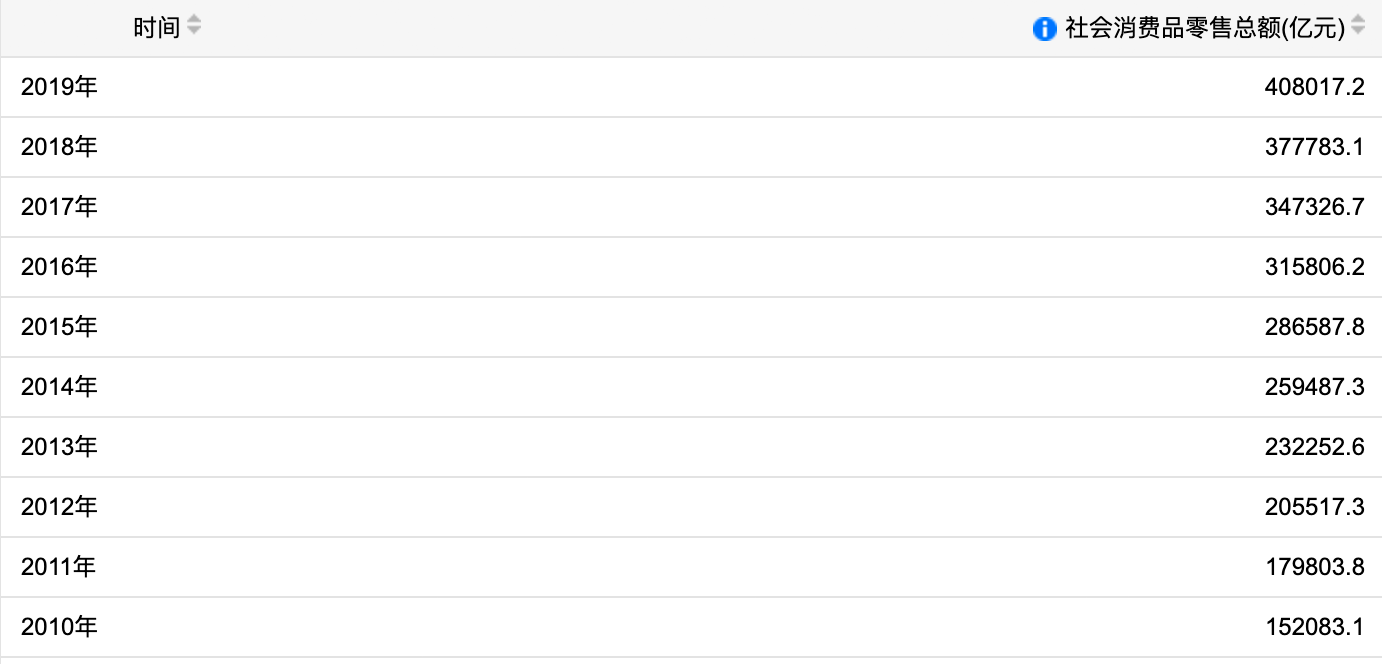
Figures in the NBS database to-date show a total amount of 40.8 trillion RMB in consumable retail in 2019. However, 41.16 trillion RMB is calculated instead by adding up the monthly amounts. According to FactWire’s analysis, the annual amount was revised as the bureau announced 2019-2020 growth rates today, while the monthly amounts, released in the beginning of 2020, were unrevised.
FactWire reported in October 2019 that the mainland authorities revise absolute amounts of the previous year but do not update them in open records accordingly. In each notice of releasing new statistics, a remark is included stating that a revision of past data has been made, along with a growth rate that is calculated based on the revised amount of the previous year. Yet, the revised absolute amount is neither found in past notices nor in the NBS database website. Unrevised amounts of each year are still shown in the database to-date.
Kevin Tsui, a member of the Economic Research Centre of the Hong Kong Institute of Asis-Pacific Studies, and an economics associate professor at Clemson University, told FactWire that it is common for market and research organisations to quote figures from the NBS database, thus inconsistency among figures in the database may lead to the wrong calculations and analysis.
He said that since the exact revision is not clearly stated in NBS notices, it seems that 2019’s amount is made smaller such that there is growth in 2020. ‘NBS should explain why 2019’s data has to be lowered that much. Or is it because of wrong calculations in the past few years? If so, all the past values should be lowered as well. It’s quite strange,’ he said.
‘In the case of revising past amounts, the growth rates published at that time should be revised accordingly as well,’ he added.
In a response to FactWire’s enquiries through the data consultation hotline, NBS explained that the corporates involved in the statistical research last year and this year are not the same. ‘The data of this year is only based on the corporates involved this year. But what to do when we must publish a percentage change? The only way is to ask the concerned corporates their performances in the previous year, then calculate the percentage change,’ said the representative.
He told FactWire that the 2020 and 2011 data sets in the NBS database cannot be compared: ‘The values this year and last year are incomparable, so are those from last year and two years ago. Such calculations are meaningless.’
The values this year and last year are incomparable, so are those from last year and two years ago. Such calculations are meaningless.
‘When quoting the rates, those released by us should be used,’ he stressed, ‘because you would not be able to calculate the data of the previous year like us, while the figures released in the past are already outdated.’
Being asked if this is a usual practice in the international community, he pointed out that foreign countries adopt statistical methods like sampling and projection, but in China, ‘we have our own characteristics in our country.’
Concerning the discrepancy between the yearly and monthly figures of consumable retail of the same period, he said the annual value and the total value from January to December do not match because they are reported to NBS at different times. Monthly values are reported each month, while annual values are reported in March of the following year.
When asked if it is misleading to ‘turn a drop into growth’ by making great revisions, the NBS representative was unsure. ‘A separate department is responsible for this. We do not know how the revisions are done,’ he said.
However, inconsistent data announced this year and last year is being compared in NBS’s own notices too. Taking the notice titled ‘National Economy Recovered Steadily in 2020 with Main Goals Accomplished Better Than Expectation’ posted today as an example, the attached chart includes rates that are calculated from both revised and unrevised amounts.
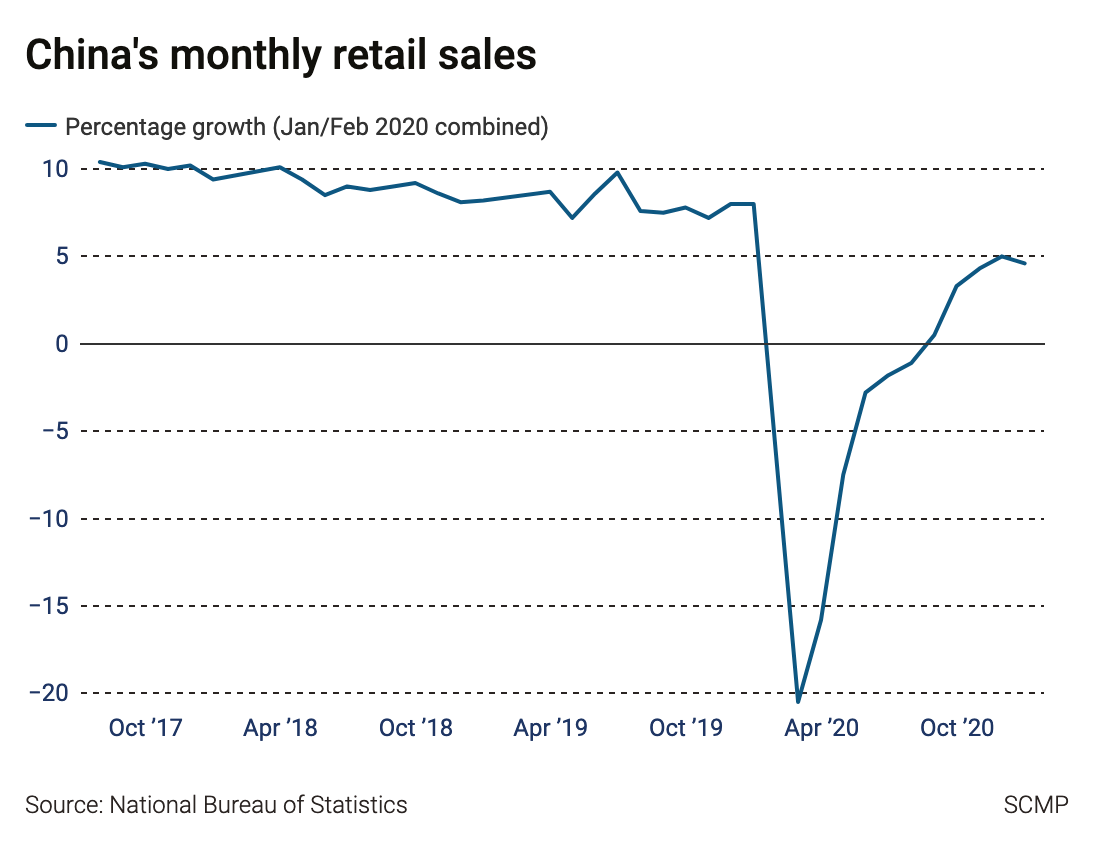
The same mistake also appears in reports by other organisations. In a report by the South China Morning Post today, monthly growth rates of consumable retail from 2017 to 2020 are quoted altogether in one chart. In the report ‘China Economic Quarterly Q2/Q3 2020’ published by PwC in September 2020, the growth rates of fixed-asset investment as stated in each year’s official release are included in the same chart.
For fixed-asset investment statistics, the revision remark is included in the notices from December 2018 onwards. A cumulative growth rate of 72 percent can be calculated by comparing the published amounts in 2020 (51.89 trillion RMB) and 2011 (30.19 trillion RMB), while ‘another’ cumulative growth rate of 144 percent is calculated from the yearly growth rates published each year. The two versions of rate are 72 percentage points apart.
For consumable retail statistics, the revision remark is included in the notices of 2015, 2018 and 2020. A cumulative growth rate of 116 percent can be calculated by comparing the published amounts in 2020 (39.2 trillion RMB) and 2011 (18.12 trillion RMB), while the other version of 121 percent is calculated from the yearly growth rates published each year. The two versions are about 4.3 percentage points apart.
Last Thursday (January 14), China’s General Administration of Customs announced a 18.1 percent year-on-year growth in the country’s exports in December 2020, and a 6.5 percent growth in imports, in USD, beating market expectations. This marks China’s trade surplus reaching 535.03 billion USD, the second highest since 1950. Customs spokesman Li Kuiwen said that China is the only major economy worldwide experiencing a growth in goods trade.
According to the latest China economic forecast report by the World Bank on December 23, 2020, the Chinese economy has a two percent growth in 2020, and is looking forward to a 7.9 percent growth in the coming year.